23 UOAs database for audi/VW 2.0l FSI turbo

Status
Not open for further replies.
Joined
Nov 28, 2007
Messages
1,877
Location
Pacnw
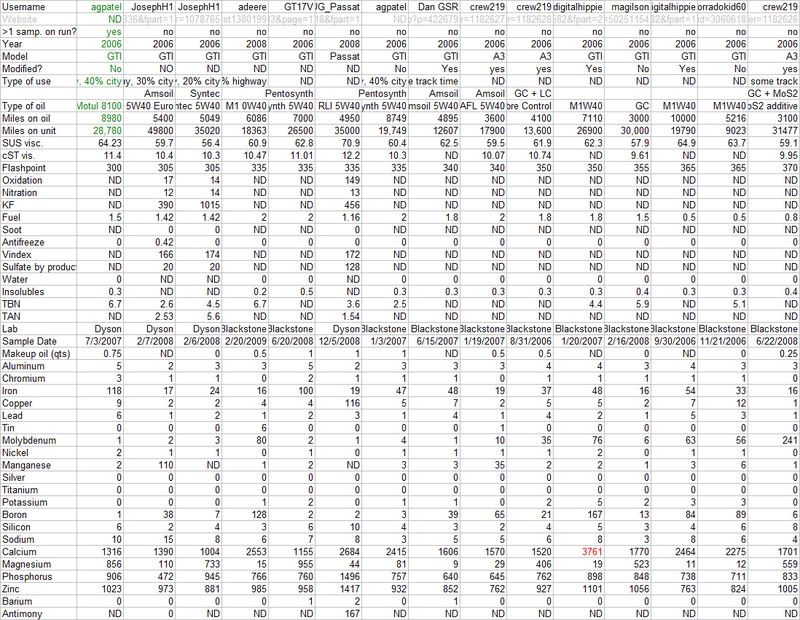
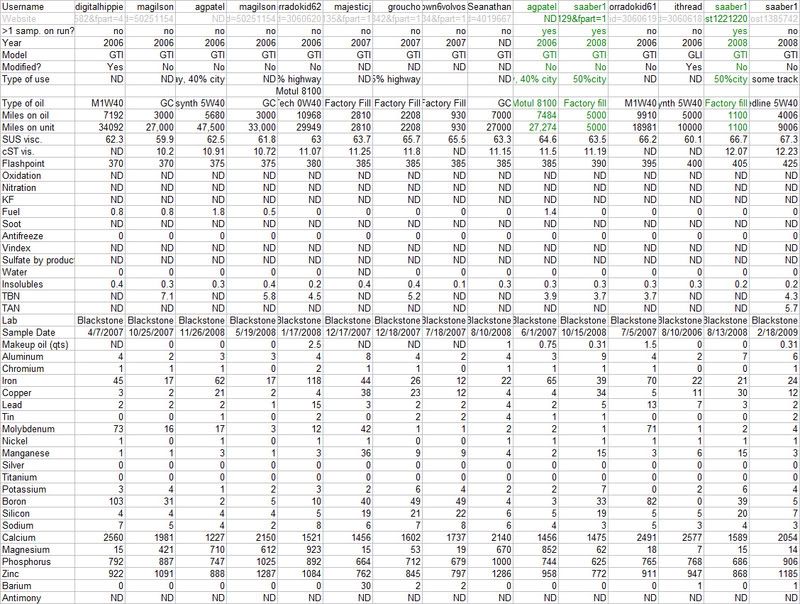
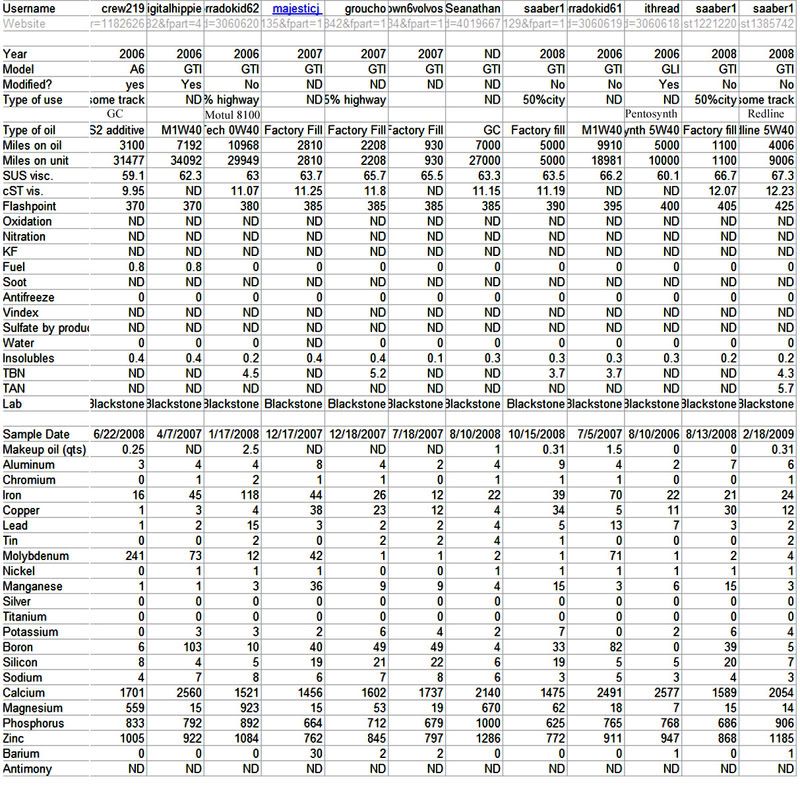
Here is a compilation of all the UOAs I could find for the 2.0l FSI engine. This database does not include Veedubb's previously posted UOA database as I could not find the original posts for that data: http://www.bobistheoilguy.com/forums/ubb...true#Post974166 Credit the database idea to RS_RL1 and Veedubb.

My intention here is to post the raw data with no interpretation for others to play with. If you want the excel file so you can re-sort the data, make your own graphs, etc. just send me a personal message with your email and I will send it to you.

One important thing to remember here is this is data from many different units, driving methods, climates, etc., etc. and the population size itself is not statistically significant. Thus this is for "entertainment purposes only" really. It is for fun, not trying to prove a point.

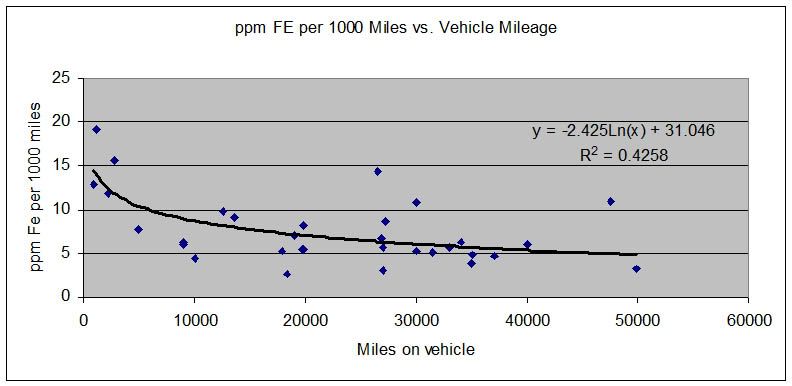
I will post up some graphs later when I get time. Also FYI the database has the original websites where the discussion for original UOAs can be found which may be helpful if you are trying to track down why a certain UOA looks the way it does or if you want to ask a questions to the poster of the original data.

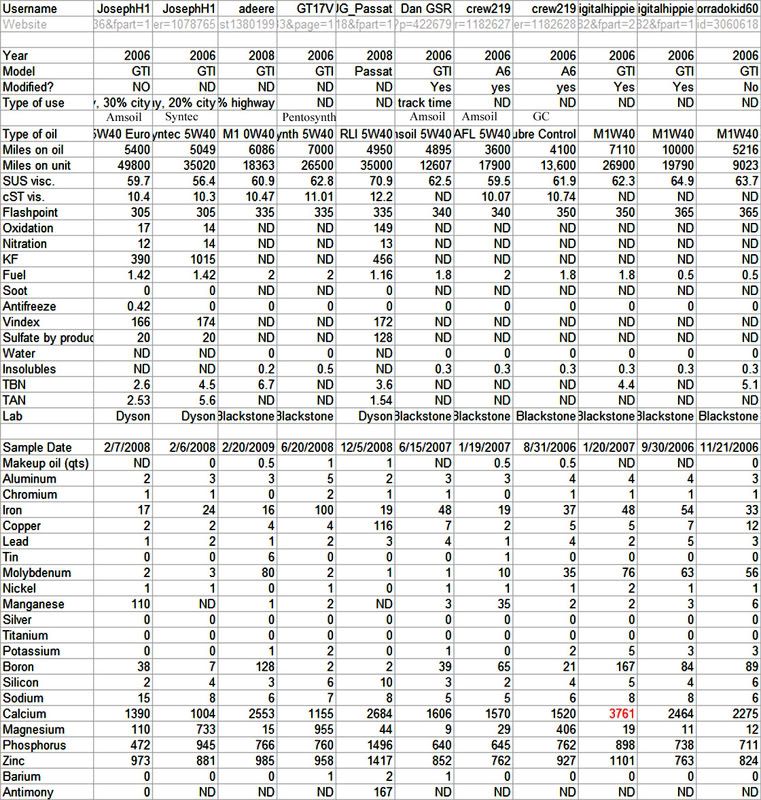
The red text for the calcium number on one spot indicates what I believe to be a typo.

Untitled-Dcopy.jpg
Untitled-ccopy.jpg
 
I drive an A3 . . . and you may want to search for magilson's UOAs. He's done quite a few on GC and they have all been excellent.

Dave
 
Originally Posted By: crew219
I drive an A3 . . . and you may want to search for magilson's UOAs. He's done quite a few on GC and they have all been excellent.

Dave

Great! I found 3 3000-mile UOAs on GC for Magilson. I'll add those to the database, change your model to A3, and post the updated list. Thanks very much for the lead on the UOAs and the correction.
11.gif
 
That's some serious Fe shedding on some of these engines. It would be interesting to know which engines have been diagnosed with the fuel pump cam problem.
 
Here's a fun plot.

Two specific samples pop out to me as being outliers. The 4th column (GT17V) in the first section, and the 3rd column (..radokid32) in the 2nd section.


2.0%20TFSI%20Fe.jpg
 
Last edited:
I'm surprised that no one else has followed up on this. This could actually be a very interesting discussion, since there is wealth of real information in this data, showing how UOA data can be used to form informed scientific conclusions.
 
Last edited:
Remember that if you had 1,000 of the exact same engines the good old bell curve would would rear its ugly head. Also depends on what conditions the engine is operating under. 5,000 of w.o.t. track use will show different numbers all things the same over freeway driving without traffic on I80 between Reno and Elko Nevada.
 
I send him a few UOA that i had for my GTI. One thing you to keep in mind is that it is a Iron block and is not all that uncommon to see elevated Fe numbers on VW/Audi motors. To what level is this normal I could not tell you positively. But, i am running RLI full time now. On my 2ed run of it no but had some other oil in between, so I will be changing the RLI out soon and putting some fresh oil in so I can get past the cleaning phase of the oil and get a comparison of how RLI has done.
 
Added 7 more UOAs which brings total to 30. Also colored text green for runs where there was more than one sample taken. I did this so we don't mistakenly interpret them as two seperate runs when looking at the data. Send pm with your email address if you would like me to send you the spreadsheet so you can sort how you want/make graphs, etc.

UOAdatabaseH.jpg
UOAdatabaseI.jpg
 
saaber, can you send me a pm with your email? I'll send over a more recent blackstone UOA from magilson with more miles and etc. Just need to edit out his personal info and whatnot.

Dave
 
Originally Posted By: Steve S
Remember that if you had 1,000 of the exact same engines the good old bell curve would would rear its ugly head. Also depends on what conditions the engine is operating under. 5,000 of w.o.t. track use will show different numbers all things the same over freeway driving without traffic on I80 between Reno and Elko Nevada.


The "bell curve" concept can be a bit misleading, and some use it to obfuscate discussions. It is based on the field of stochastic processes, which makes some fundamental assumptions about the randomness and independence of the natural world. One particular assumption that you have to be careful about is independence. If two things are truly independent, there is no correlation between them, and therefore, if you take a bunch of them and measure them, you'll see something approaching random.

When it comes to automotive engines, not everything is independent between two engines. The design of an engine and it's metallurgy are highly correlated across multiple engines of the same type. Therefore, we treat them as dependent processes and know that if we make enough measurements that depend on them, those measurements will approach a mean. In any engine design, there is a statistical envelope for it's behavior.

Variation from the mean, however, is random, since there is uncertainty from engine to engine in manufacturing, and when you add these uncertainties together across 1000's of engines, yes, you will see something that is like a bell curve. However, in modern engine design, this statistical process curve is extremely tight, unless there are design or manufacturing flaws.

Automotive manufacturers certainly do not test 1000's of engines prior to production. They do not need to since they can extrapolate the testing that they do perform on 10's to 100's of engines to the population as a whole, because they know their manufacturing process controls. The better the controls are, and the better the CAD modeling tools are, the tighter the ransom part of the process distribution is, allowing designers to shorten the testing process, since they don't need as many test engines to fully characterize it's operation and reliability.

Now, in the "real" world, under driving and maintenance conditions, there are certainly other uncorrelated random variables. However, most of these have a minimal influence on modern engines. People talk about the "impact" of tracking and WOT on engines. However, it turns out that most of the engines that this is done with have significant margin by design, and as a result, there is minimal impact.

The 2.0 TFSI engine is one of these. It has an incredible amount of design margin, as evident in the ability of it to be modified to put out impressive levels of power by tuners who warranty their modifications, like Stasis does. (320 HP / 310 lb-ft torque with a 4-year / 50,000 mile warranty.) As a result, I'd expect minimal impact on UOA for an engine that is operating properly. For example, I've seen many UOA results of Audi RS4 engines that have been run on the track vs. just the street, and the differences are essentialy negligible.

There are other uncorrelated random processes that can give rise to differences: fuel, oil, contaminants, cold starting ... etc. And of course, internal design problems can also result in significant uncorrelated differences between engines.

So when looking at these sorts of plots, I generally like to look at all the indicators, and especially for the outliers that pop out. Even with a "bell curve" or more formally a gaussian probability distribution, there are limits to what the real world can produce. Sometimes these outliers, like those I pointed out, are in the range of probability for what might happen between a large number of engines. Maybe they are not. That's why I like to look at curves like these and try to visually identify the trend for the mean over engine mileage. (BTW, automotive designers do exactly the same thing when testing on a dyno and performing near-real-time oil analysis.) Then, when I see an outlier that is significantly outside of the mean I take a closer look.

Might be nothing. However, knowing the problems these engines have had with the high pressure fuel pump lobe on the camshaft, my interest is peaked. No matter what, there is definitely something different about the two engines I pointed out.
 
Last edited:
Some of the numbers seem somewhat consistent and some are all over the place I really wonder why the why part messe me up .The developement of direct injection interests me . The problems with the 2 stroke outboard engines somewhat seem to me [I an definatly not experienced it the problems involved ] vaguely alike.
 
I have trouble believing some of those that are reported using GC really is GC as we know it. I have never seen actual GC number shear down in such short intervals as smoe of those reports say.
I think they are likely using Castrol but either the American version, or 5w-30 Syntec, or another Euro type that is is shearing.
 
Originally Posted By: jmac
I have trouble believing some of those that are reported using GC really is GC as we know it. I have never seen actual GC number shear down in such short intervals as smoe of those reports say.
I think they are likely using Castrol but either the American version, or 5w-30 Syntec, or another Euro type that is is shearing.


I believe it is most likely fuel diluting, which is lowering the viscosity.
 
Originally Posted By: jmac
I have trouble believing some of those that are reported using GC really is GC as we know it. I have never seen actual GC number shear down in such short intervals as smoe of those reports say.
I think they are likely using Castrol but either the American version, or 5w-30 Syntec, or another Euro type that is is shearing.

This engine is tough on oils. Here are the original posts for the german castrol UOAs so you can check for yourself. I see no reason to doubt that these are in fact GC but please take a look for yourself:

http://www.bobistheoilguy.com/forums/ubbthreads.php?ubb=showflat&Number=1182626

http://forums.vwvortex.com/zerothread?id=4019667

http://www.bobistheoilguy.com/forums/ubb...true#Post257197

about 1/2 way down the page:
http://forums.vwvortex.com/zerothread?id=3750088&postid=50251154
 
Originally Posted By: RI_RS4
Here's a fun plot. Two specific samples pop out to me as being outliers. The 4th column (GT17V) in the first section, and the 3rd column (..radokid32) in the 2nd section.

RI_RS4's graph didn't really register to me until he sent one with a regression line, and then I was like, "Ah I get it, cool!"

The line shows typical iron numbers across this really small data set. Then a person could see if the iron (ppm/1000 miles) on their own UOA is higher or lower than the line, which represents the "norm". Here is a graph of the newest data (includes 3 new UOAs) using RI_RS4's (aka "The Datamaster") graph idea. This would obviously be better if we had a lot more data but this is all we have to play with.

I'll also post the updated spreadsheet but don't want to post that too often because image files are huge and make this thread hard to read. Plez pm me if u want excel file.

20FSIppmironchartmarch1209.jpg
 
Nice work saaber!

Yes, that's exactly what I see in my mind when I look at these composite plots. With enough data points, across enough vehicles, what I call the average wear curve will become well defined, as most of the points will cluster around the curve, and the outlying points will begin to stand out.

Once engine mileage gets above 20K you can start seeing a significant cluster around the mean that begins to form. Stuff 2x or 3x above these clusters are things that I would consider problematic, and would want to look at in more depth.

Points below the curve also tell us something, since there are reasons these are lower. Further analysis can often show what these owners are doing right. It could be the oil. It could be the change interval. It could be the fuels in their region of the country. It could be better cleaner air filters.

I think this is the real power of individual UOAs, and should be proof positive that a used oil analysis can be much more valuable than just determining the OCI.
 
not sure how much correlation you can put into wear numbers from UOA and actual engine wear.

you have to keep in mind that these UOA only capture particles in narrow size range..without total particle count it is hard to tell which oil is better
 
Last edited:
I can't seem to read all the text in the UOA's on page one. Was there a sample for Mobil 1's 5w-40 diesel oil? I'd like to try this oil in my 2.0TFSI engine.

Changing the oil this weekend with 5k on it that is GC. Yes I am planning on sending it out to blackstone.
 
Status
Not open for further replies.
Back
Top