Originally Posted By: Gokhan
Originally Posted By: Garak
Originally Posted By: Gokhan
Garak, it's a simple first-order differential equation. Every first-order differential equation has a solution that is an exponential. All it is saying is that the rate of evaporation is proportional to the amount of material remaining. There is no quantum physics here. It's a very basic concept. dy(t)/dt ~ -y(t). This equation pretty much goes into any physical phenomenon.
We don't know the shape of the curve, which means you cannot yet interpolate. We know nothing about the function. And yes, if you want to include time, we do need to find plots as a function of time. Well, you do, not me, because you're trying to introduce time to this.
 Of course there's no quantum physics here, which is why the curve matters. It's not a probability curve where only the beginning and end matter with the path irrelevant.
Read Shannow's link here from another thread. At first glance, that's the type of setup one would need to get some appropriate data. And no, the curves they've drawn in their little paper aren't data. But, at least it can be done.
There it is! This reference is thanks to the friendly CharlieBauer:
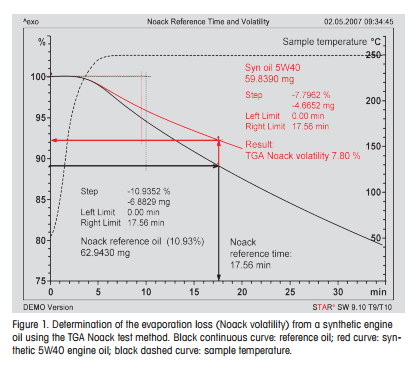
Determination of the NOACK evaporation loss of lubricants by TGA
This is not the more common ASTM D5800 NOACK evaporation test but an alternate version ASTM D6375 that works much faster (less than half hour) and is more repeatable.
NOACK evaporation precisely has the form of an exponential function exp(-t/T), where t is in hours, and for allowed NOACK's, the curve is very linear for t < 1/2 hour -- exp(-t/T) ~ 1 - t/T.
Note that the initial part of the curve is flat because the sample is still heating. I didn't account for that but that's a small error.
I hope this finally eliminates the skepticism.
In the example provided in the picture, for the given apparatus, the results are read at 17.56 minutes (calibration against the reference oil). Therefore, the sample mass = exp(-[t/17.56]*NOACK) ~ 1 - [t/17.56]*NOACK, where t is in minutes. So, for t = 17.56 minutes, sample mass ~ NOACK.
In fact, this test not only validates my point but uses the exponential form and therefore the linearity for small time of the evaporation for the method to actually work!

Where does Mettler claim that the curve is exponential, and how can 30% (5 minutes out of 17) be declared a “small error”?
Originally Posted By: Garak
Originally Posted By: Gokhan
Garak, it's a simple first-order differential equation. Every first-order differential equation has a solution that is an exponential. All it is saying is that the rate of evaporation is proportional to the amount of material remaining. There is no quantum physics here. It's a very basic concept. dy(t)/dt ~ -y(t). This equation pretty much goes into any physical phenomenon.
We don't know the shape of the curve, which means you cannot yet interpolate. We know nothing about the function. And yes, if you want to include time, we do need to find plots as a function of time. Well, you do, not me, because you're trying to introduce time to this.
Read Shannow's link here from another thread. At first glance, that's the type of setup one would need to get some appropriate data. And no, the curves they've drawn in their little paper aren't data. But, at least it can be done.
There it is! This reference is thanks to the friendly CharlieBauer:
Determination of the NOACK evaporation loss of lubricants by TGA
This is not the more common ASTM D5800 NOACK evaporation test but an alternate version ASTM D6375 that works much faster (less than half hour) and is more repeatable.
NOACK evaporation precisely has the form of an exponential function exp(-t/T), where t is in hours, and for allowed NOACK's, the curve is very linear for t < 1/2 hour -- exp(-t/T) ~ 1 - t/T.
Note that the initial part of the curve is flat because the sample is still heating. I didn't account for that but that's a small error.
I hope this finally eliminates the skepticism.
In the example provided in the picture, for the given apparatus, the results are read at 17.56 minutes (calibration against the reference oil). Therefore, the sample mass = exp(-[t/17.56]*NOACK) ~ 1 - [t/17.56]*NOACK, where t is in minutes. So, for t = 17.56 minutes, sample mass ~ NOACK.
In fact, this test not only validates my point but uses the exponential form and therefore the linearity for small time of the evaporation for the method to actually work!
Where does Mettler claim that the curve is exponential, and how can 30% (5 minutes out of 17) be declared a “small error”?