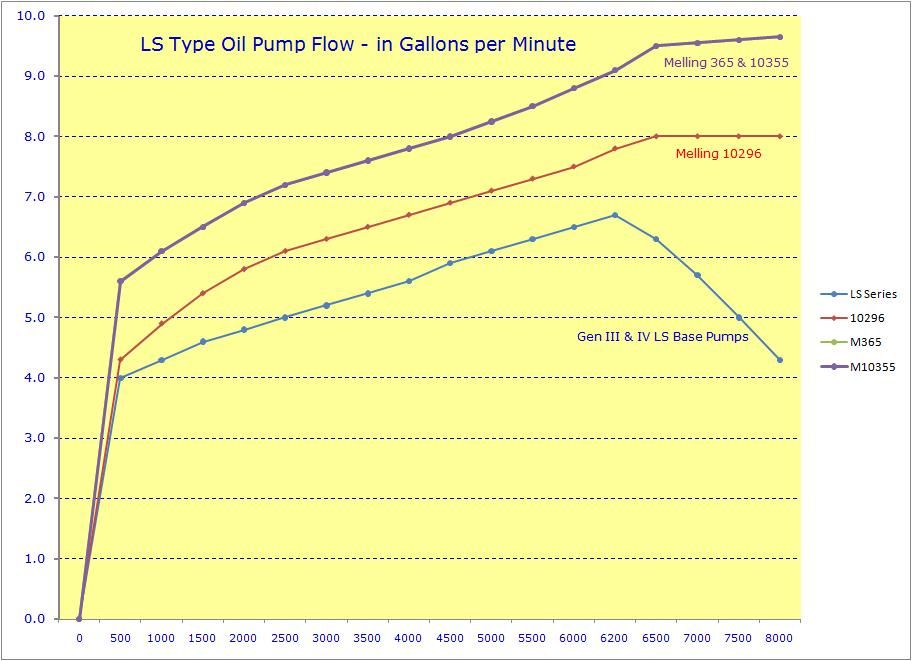
The two graphs above show the same thing - a linear increase in pressure or flow with RPM until the pressure release valve opens. This phenomenon cannot be rationally disputed, granting minor variation.
As long as the pump is positive displacement and has a pressure relief valve, pump design is not relevant for the shape of the curve on these graphs.
The engine demand will vary, but shape of the curve will be similar. The lubrication points of the engine do need much pressure until a threshold RPM is reached. That phenomenon will remain true without regard to engine design. Individual designs will have different threshold.
However, oil serve other roles beyond lubrication, cooling for example. Designs that use oil spray to cool, may have vary different demands. In general though, the pump will exceed those needs at lower RPM. If it didn't, there would be failures.
I think that marting's comment is related to the degree of over-capacity that is in the design. It may not be intuitive that lubrication needs can be met with low pressure/flow at lower RPM. However, it would be rather silly to argue that the over-capacity does not exist when it is required for safety margin in the design.