Renewables Experiment in Oz - keep watching

Status
Not open for further replies.
Originally Posted By: SHOZ
The facts are there.


No they aren't, that's the problem. We are provided with installed capacity and new installed capacity, which is being pimped intentionally without including actual generating output because that wouldn't look as good.

Originally Posted By: SHOZ
You can slice and dice them all you want.


I can only "slice and dice" what I'm provided. What do you think the site you keep citing is doing, providing us with an unbiased, entirely neutral viewpoint?

Originally Posted By: SHOZ
New hydro is being developed, lets hope no more droughts. And yes natural gas is replacing coal at a fast rate. Our many landfills produce quite a bit.


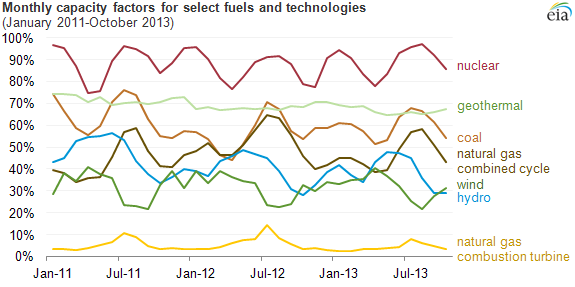
Hydro is a fantastic resource and probably my favourite generator given that it can provide baseload unlike wind and solar. Natural gas is cheap and flexible, so it isn't a surprise to see its installed capacity approach 50%. If it is being leveraged primarily for baseload and not peaker usage it likely makes up close to 70% of your actual output too, food for thought. Methane from a landfill isn't the same thing as Natural Gas procured from wells though, I would be surprised to see it make up even half of the fuel source for these facilities, which are likely fed the same NG that is heating homes like what is used up here.
 
Originally Posted By: IndyIan

Wind and pumped storage would seem to the technology to bet on in the future IMO, atleast where water is plentiful. No CO2 emissions or nuclear level complexities to deal with.
http://www.genewsroom.com/press-releases...-hydro%E2%80%94


Yes, I've seen a few different models of this in the last year or so, one included a large reservoir so that it was essentially a dam/turbine arrangement coupled with wind for pumping.

The concern with models in Germany is of course that their electricity prices are like the 2nd highest in the world. They are around $0.40/KWh, which is insane. These rates are a direct result of all this experimentation, so that's something to keep in mind.

Huge hydroelectric installs like Quebec's James Bay project could power entire European countries, so there is the scale factor to consider as well.
 
And for the benefit of others reading this:

The James Bay Project was a massive hydro-electric undertaking embarked upon by the province of Quebec. It has an installed capacity of 27,000MW if the smaller sub projects are factored in along with the 2nd generation installs.

The Phase I installs (10,800MW) operate at roughly 60% of their installed capacity on average and produce 65 TWh of power per year.

The Phase II installs (5,200MW) operate at between 60 and 70% and produce on average 18.9 TWh of power per year.

This gives us a total output for just these two phases @ 16,000MW of 83,900GWh.

Averaging the above we end up with an output of 5.24GWh per MW of installed capacity, which, if applied to the entire system gives us an output of 141,480GWh of power. That could almost power the entire province of Ontario.
 
Originally Posted By: OVERKILL

No they aren't, that's the problem. We are provided with installed capacity and new installed capacity, which is being pimped intentionally without including actual generating output because that wouldn't look as good.


I don't know of any generator that runs at 100% all the time. Locally with the wind farms they underestimated their output when designing. It's nearly 50% more than they planned for over a 24 hr period.
 
Originally Posted By: SHOZ

I don't know of any generator that runs at 100% all the time.


That's pretty much the premise of baseload. Our nukes run well into the 90's all the time. Darlington's annual record was 94.5% for 2008.

Originally Posted By: SHOZ
Locally with the wind farms they underestimated their output when designing. It's nearly 50% more than they planned for over a 24 hr period.


OK, but that still doesn't mean they can generate and meet grid demands 24/7, which is the issue. Hence the pursuit of things like pumped storage that Ian touched on above. If the intermittency wasn't an issue, this wouldn't be required. But it is an issue, a HUGE issue, and that's why solutions are being looked into.

Here's a sample of your US market. Your nukes average around 90% output.

US_EIA_monthly_capacity_factors_2011-2013.png

Quote:
The net capacity factor of a power plant is the ratio of its actual output over a period of time, to its potential output if it were possible for it to operate at full nameplate capacity continuously over the same period of time. The capacity factor is calculated by dividing the total amount of energy the plant produced during a period of time and divide by the amount of energy the plant would have produced at full capacity.
 
Originally Posted By: OVERKILL
Originally Posted By: SHOZ

I don't know of any generator that runs at 100% all the time.


That's pretty much the premise of baseload. Our nukes run well into the 90's all the time. Darlington's annual record was 94.5% for 2008.

Originally Posted By: SHOZ
Locally with the wind farms they underestimated their output when designing. It's nearly 50% more than they planned for over a 24 hr period.


OK, but that still doesn't mean they can generate and meet grid demands 24/7, which is the issue. Hence the pursuit of things like pumped storage that Ian touched on above. If the intermittency wasn't an issue, this wouldn't be required. But it is an issue, a HUGE issue, and that's why solutions are being looked into.

Here's a sample of your US market. Your nukes average around 90% output.

US_EIA_monthly_capacity_factors_2011-2013.png

Quote:
The net capacity factor of a power plant is the ratio of its actual output over a period of time, to its potential output if it were possible for it to operate at full nameplate capacity continuously over the same period of time. The capacity factor is calculated by dividing the total amount of energy the plant produced during a period of time and divide by the amount of energy the plant would have produced at full capacity.
Well over 90%. Maybe 90% average. Not the case for nukes in the US. And I for one do not expect renewable to be at 100% for some time. There has to be the storage projects ramped up and put in place first.
 
Originally Posted By: SHOZ
Well over 90%.


The Ontario plants are well over 90%, hence the 94.5% average for Darlington I cited.

Originally Posted By: SHOZ
Maybe 90% average. Not the case for nukes in the US.


Please re-read what I posted. The above graph is for the US energy industry, that 90% (roughly) is for YOUR nuke plants.

Originally Posted By: SHOZ
And I for one do not expect renewable to be at 100% for some time. There has to be the storage projects ramped up and put in place first.


I doubt it will every hit the levels that can be reached with something like Nuclear. Even hydro electric is 30% less easily, and it runs 24/7. Nukes are most efficient at maximum output, so that's where they generally stay. Hydro has no cost penalty associated with ramping back output so it can be used as a governor with respect to grid response/demand. This variability is what you see in the above graph. Other thermals like coal and natural gas use less fuel when throttled back so there is more variability with them as well, unlike with the nukes.
 
Well that's good for you in Canada I guess. In the US the waste problem and the tremendous labor cost overhead have made nuclear nearly unprofitable. In fact in Illinois where the largest concentration of nuclear plants in the US we just had to pass a mutil billion dollar subsidy program so they don't close a third of the generation up.

And yes I know your waste problem is not the same as ours.
 
Here's another graphic, this is a 7-day snapshot of Ontario:


As you can see, the nukes provide the vast majority of the baseload with hydro making up the difference. On top of that wind is used when available, when it isn't, you can see Natural Gas is used instead. Solar and Biofuel barely register and are basically insignificant.
 
Originally Posted By: SHOZ
Well that's good for you in Canada I guess. In the US the waste problem and the tremendous labor cost overhead have made nuclear nearly unprofitable. In fact in Illinois where the largest concentration of nuclear plants in the US we just had to pass a mutil billion dollar subsidy program so they don't close a third of the generation up.

And yes I know your waste problem is not the same as ours.


To be clear, I'm not advocating Nuclear. I'm simply pointing out the significance of baseload generation relative to intermittent. Hydro can, like it does in Quebec, fit the bill just fine. They have some of if not THE cheapest power in the entire country, unlike here in Ontario. This is because Quebec's energy industry was not subjected to the same agenda-driven lunacy that we suffered.

I'm a fan of honest discourse. This means we need ALL the data. When something is presented without proper scale (which GWh or TWh provides when coupled with a total) then generally the purpose is to be misleading. So this is not an attack on you or your ideals but rather the source, which, and I'll say it again, is not without bias.

The energy industry is complex and it tends to be vastly over-simplified when one works to further an agenda, as delving into the nuances becomes tedious and takes away from the clean-cut positivity that can be championed when one doesn't bother with the details.

Comparing installed capacity relative to output and demand is nothing more than an honest discussion unless somebody tries to steer it away from that. That is all I'm trying to have here. Without output and total demand we are looking at one side of a three dimensional object. You cannot have a discussion about the whole without seeing it and that's what I'm saying.

Make sense?
 
Originally Posted By: SHOZ
Good thing the article I posted is about the US.....


Yes, a one-dimensional article from a biased source relative to a three-dimensional topic. Please, if you could find data that is as detailed as what I've provided for Ontario, this will allow an honest and more complete dialogue to take place.

That of course is if you want this to be an honest discussion and not one that revolves around snippets and soundbites because an agenda is being served.
 
And that's my point. You cannot use the installed capacity for anything as an indicator for actual output. In the US the nukes only run at +90% in the summer.
 
Originally Posted By: SHOZ
And that's my point. You cannot use the installed capacity for anything as an indicator for actual output. In the US the nukes only run at +90% in the summer.


The graph I posted earlier is a US graph. I've said that THREE TIMES. It covers January through to October for what amounts to almost a three year period. It shows nukes average out at around 85-90% output. And in fact, a lot of the high points occur in and around the months leading up to and away from January.

Each generation type is well represented in that graph, save solar. It illustrates, quite well, the differences in output between the different technologies and that's exactly why when an article, like the one you've linked, ONLY lists installed capacity without citing output, it is being misleading because it does not provide any sort of scale relative to other technologies in the mix and the total demand being satisfied.
 
Who do you think the source of the graph I posted was? I'll give you a hint, it has that same little eia logo on it.....

And what you've just posted supports what I just said. It starts ramping up in October, hits a high in the middle of winter, and then comes back down a bit in the spring, then back up for the summer, then down in the fall. It follows demand.

Note that it does NOT support what you stated, which was that they only run at 90% in the summer. December through January in what you just posted is higher than the summer months. Looking at the other graph, this shows an output of ~95% for those peak periods and a low of around 80% for the shorter periods of lower demand in the spring and fall. Averaged, we are looking at 85-90% over the course of the year.
 
So you are cherry picking your data and then complaining about what I post??????

And yes I forgot about the Christmas light season......

Do you have similar info over the few years for yearly output?
 
Originally Posted By: SHOZ
So you are cherry picking your data and then complaining about what I post??????


? I posted the data that covers almost three years with a good cross-section of generation modes which allows us to see the averages. How in the flying heck is that cherry picking??

Quote:
And yes I forgot about the Christmas light season......

Do you have similar info over the few years for yearly output?


Christmas lights start in October? I don't think so. What you are seeing starting in the late fall and then tapering off through the spring is electric heat. What you are seeing in the summer is Air Conditioning. The dips are when neither of those things are needed, which are the spring and fall. Pretty simple.

Can you clarify that last question? The graph I already provided was yearly output for close to three years, what is it exactly you are looking for?
 
I'm not looking for anything. You are the one who started the same old tired arguments. In the US they rate the nuke plants on their summer capacity, where they run +90% 24/7.
 
Status
Not open for further replies.
Back
Top