You are using an out of date browser. It may not display this or other websites correctly.
You should upgrade or use an alternative browser.
You should upgrade or use an alternative browser.
FR-IR oil analysis
- Thread starter mugen884
- Start date
- Status
- Not open for further replies.
I wouldn't call myself an expert, but I've analyzed a good number of FT-IR results.
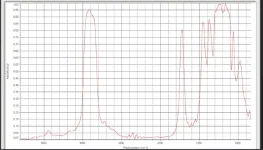
It looks like there is a fair amount of ester base oil in there that jumps out, but what are you trying to discover about the oil with this scan?
It looks like there is a fair amount of ester base oil in there that jumps out, but what are you trying to discover about the oil with this scan?
all that is possible to see.Non mi definirei un esperto, ma ho analizzato un buon numero di risultati FT-IR.
Sembra che ci sia una discreta quantità di olio base estere che salta fuori, ma cosa stai cercando di scoprire sull'olio con questa scansione?
esters is there, it's true. but I think it is impossible to understand the family and the%.
what else can you see
Ciao!!! I can see you're a Mugen fan... so am I... in fact I've met the CEO of Mugen Hirotoshi Honda...
fantastico!! complimenti!!Ciao!!! Vedo che sei un fan di Mugen ... lo sono anch'io ... infatti ho incontrato il CEO di Mugen Hirotoshi Honda ...
mugen è mugen
benvenuto nel club
")
fantastic!! compliments!!Ciao!!! I can see you're a Mugen fan... so am I... in fact I've met the CEO of Mugen Hirotoshi Honda...
mugen is mugen
welcome to the club honda mugen
The height of the peak would make me assume that oil has at least 2% ester. Less than 2% and greater than 2% (rough estimate) is about where I always saw the difference in peak height from relatively small to relatively large. No real way to tell the type of ester from that scan though.all that is possible to see.
esters is there, it's true. but I think it is impossible to understand the family and the%.
what else can you see
Beyond that, I can see that the oil has additives and petroleum oil based on the other peaks. There is no real way to discern what types or quantities though.
I'm saying that 2% was a common threshold I saw where the spike on the graph might be noticeably different.only 2% ?
Under 2%, the peak height would be quite variable depending on the actual concentration.
Above 2%, and the peak height didn't really change all that much. So, for instance, 2%, 5%, and 10% would look pretty much the same on the FT-IR results.
In the pharmaceutical industry we use FT-IR for identification purposes to confirm what we bought as raw materials are correctly labeled and the right stuff. We compare the sample and reference spectra to confirm identity. When we first installed an FT-IR in our lab, the company told us that FT-IR was used in forensic analysis for car paint. If a car was hit and run and left some paint behind they could analyze it and based on its spectra and comparison to a state police library, identify the color and make/models of cars that used that color.
Without references, I don't know how you'd perform any semi-quantitative analysis with FT-IR.
Without references, I don't know how you'd perform any semi-quantitative analysis with FT-IR.
References are typically required if you want any usable information from an FT-IR result. That was why I asked what the OP was trying to really look for. General information about a product isn't going to be gleaned from an FT-IR scan.
In the pharmaceutical industry we use FT-IR for identification purposes to confirm what we bought as raw materials are correctly labeled and the right stuff. We compare the sample and reference spectra to confirm identity. When we first installed an FT-IR in our lab, the company told us that FT-IR was used in forensic analysis for car paint. If a car was hit and run and left some paint behind they could analyze it and based on its spectra and comparison to a state police library, identify the color and make/models of cars that used that color.
Without references, I don't know how you'd perform any semi-quantitative analysis with FT-IR.
today I spoke to a technician who works in a lubricants company and he sees peaks of phthalates and trimellitates.
assumes a 15-2 '% foreign share. he told me that the experience based on the size of the wave makes him assume the% of the component (in this case of the base).
therefore we can say that those with great experience can understand a lot from a single analysis.
definitely the MASS GAS, it helps with certainty to understand the% but they are details ...
The main Trimellitate and phthalate peak is at the same 1700 -1750 wavelength all other esters peak at. And the scan you provided doesn't' go as low as 741 cm-1, which is where you'd see the peak for the aromatic ring of a phthalate.
It's fine to assume information based on past experience, but I would not use those assumptions, even from myself, to make any conclusions regarding product composition.
It's fine to assume information based on past experience, but I would not use those assumptions, even from myself, to make any conclusions regarding product composition.
So since the peaks appear at the same wavelength you can’t distinguish the compounds?
Maybe someone can. As I said, I'm not FT-IR expert, but a peak in 1700-1750 cm-1 is typically ester. I'm not aware of a way to distinguish specific ester compounds within those wavelengths. There can be accompanying indicators like the 741 cm-1 peak I mentioned for phthalates, but within that range I do not know of a way to differentiate them.
I am not an expert on FT-IR by any means but here's my $0.02. In this scan it probably would have been better if the peaks were labelled with their wavenumbers. A modern FT-IR can do this very easily. There is a lot of stuff going in in the 1500-900 CM-1 range where there are a couple of peaks that might help differentiate esters. There may be suggestions of them but they are not well defined. In my experience, if you are looking for qualitative IR, the transmission mode often provides more detail than absorbance. If you are looking to quantify compounds absorbance, with references, is the only way to go. The 1750-1700 CM-1 peak may be the most important in this scan. The fact that it appears to be in the 1730-1715 CM-1 range suggests that it may be a trimellitate or a phthalate ester. Beyond that I don’t think you can differentiate with this scan.
MolaKule
Staff member
Unless an extensive Forensic Analysis is done it is very difficult to determine exactly what constitutes those peaks.I am not an expert on FT-IR by any means but here's my $0.02. In this scan it probably would have been better if the peaks were labelled with their wavenumbers. A modern FT-IR can do this very easily. There is a lot of stuff going in in the 1500-900 CM-1 range where there are a couple of peaks that might help differentiate esters. There may be suggestions of them but they are not well defined. In my experience, if you are looking for qualitative IR, the transmission mode often provides more detail than absorbance. If you are looking to quantify compounds absorbance, with references, is the only way to go. The 1750-1700 CM-1 peak may be the most important in this scan. The fact that it appears to be in the 1730-1715 CM-1 range suggests that it may be a trimellitate or a phthalate ester. Beyond that I don’t think you can differentiate with this scan.
There are so many DI additive components today that are esters one cannot really say the ester-type peaks is a base oil alone.
For example, ZDDP is an ester, the Boron is an ester, and the dispersant may be an ester as well.
I agree. There is room for a lot of variation in IR interpretation that requires additional analytical methods to clarify.Unless an extensive Forensic Analysis is done it is very difficult to determine exactly what constitutes those peaks.
There are so many DI additive components today that are esters one cannot really say the ester-type peaks is a base oil alone.
For example, ZDDP is an ester, the Boron is an ester, and the dispersant may be an ester as well.
I always send in a reference ester of what I think is in there best way
- Status
- Not open for further replies.
Similar threads
- Replies
- 22
- Views
- 1K
- Replies
- 19
- Views
- 730
- Replies
- 5
- Views
- 646
- Replies
- 48
- Views
- 3K