gathermewool
Site Donor 2023
That graph is very confusing. If I’m reading what you posted correctly, the charge rate shifted from 0.1A at 14.4V to 1.0A at 12.8V? Based on that, I’m going to say this graph is more of a snap-shot than a continuous plot, meaning it’s just about useless.View attachment 108346
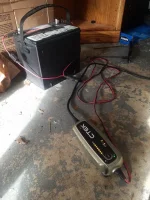
charge profile for my newest battery charger. I don't know what happens if the charge current exceeds 1.0Amps at 12.8V.
It’s l just showing that the amperage dropped to nothing at a max set point of 14.4V, turned off the charger, then picked back up at 1.0A when the battery voltage dropped back down to its ON set point. someone correct me if I’m wrong.
Do you have the ability to plot V and I vs time?

