
Originally Posted By: Gary Allan
What he meant was that it "shouldn't appear" linear when plotted on a graph if any of the multitude of UOA results are any indication of how it behaves in use.
I suppose the chart on page 16 of the presentation could just be an example of poor PowerPoint communication, but if so it is a lot worse than I'd expect from a collection of engineers.
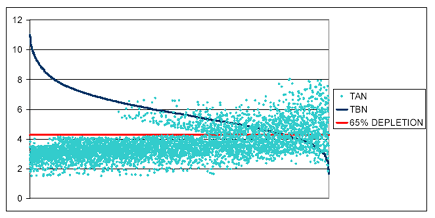
The Lubrizol chart begins a zero (0) miles of oil use. Their TBN doesn't illustrate either the starting non-linear roll-off or then ending non-linear behavior seen in this Machinery Lubrication article (authored by Polaris Labs), which claims to graph fleet test results.
TAN on the Lubrizol chart seems even more at odds with the Machinery Lubrication article, not showing a nearly-constant TAN level early in the OCI.
What he meant was that it "shouldn't appear" linear when plotted on a graph if any of the multitude of UOA results are any indication of how it behaves in use.
I suppose the chart on page 16 of the presentation could just be an example of poor PowerPoint communication, but if so it is a lot worse than I'd expect from a collection of engineers.
The Lubrizol chart begins a zero (0) miles of oil use. Their TBN doesn't illustrate either the starting non-linear roll-off or then ending non-linear behavior seen in this Machinery Lubrication article (authored by Polaris Labs), which claims to graph fleet test results.
TAN on the Lubrizol chart seems even more at odds with the Machinery Lubrication article, not showing a nearly-constant TAN level early in the OCI.